Educational article with video
Export Product Analysis: From Market Statistics to Customers and Supply Capabilities
A detailed article from Mostafa Nezamparvar's export product analysis lesson: matching products to the person and supply structure, statistical limitations, market concentration, unit value, growth and reasons for demand, with the bedding example and conceptual diagrams.
Based on a talk by Mostafa Nezamparvar

Full article contents
- Choosing goods does not end with naming a large market
- How do statistical and fundamental analysis differ in this lesson?
- Include the purchasing process and customer relationships in the analysis
- First ensure the statistics actually relate to your product
- Compare the product with your knowledge, interests and learning capabilities
- Examine the supply structure and dependence on the manufacturer
- Separate market size from the profitability of your own activity
- Read imports at both global and regional levels
- A major importing country may be a distribution hub
- Consider competitors and possible transport advantages alongside demand
- Do not confuse unit value with market size
- Compare short-term and multi-year growth
- Fundamental analysis should connect the reasons for demand with business decisions
- Reviewing the analytical sequence in the bedding example
- About this talk
Full lesson video
Overview of the lesson's topics
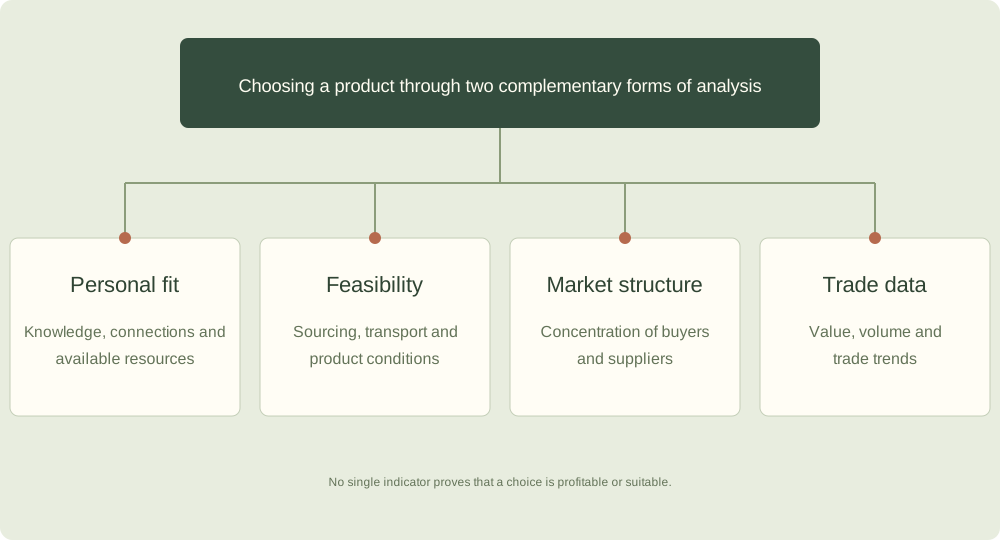
Choosing goods does not end with naming a large market
A country's large imports or a product's export reputation do not alone show that the goods suit our starting activity. In this session, Mostafa Nezamparvar combines market information, buyer behaviour and the trader's own capabilities. The goal is a choice that can realistically be worked on.
The question is not only which country buys most. Ask why it buys, why another country's purchases fell, how to reach the buyer and how a new supplier might compete. Tables and charts provide part of the answer; causes of change and transaction conditions require separate investigation.
The educator illustrates the method with bedding, equipment, construction products and workshop-made goods. These examples explain the analytical method, not a recommended product list or ranking of today's markets.
An early question concerns a country's sudden change in position as a buyer: why does a market with little presence in one period appear among major buyers in the next?
He uses this example to show that viewing a table is not enough. Identify the change and investigate its cause; the answer may alter the approach to entering that market.
He also distinguishes fashion or clothing products from goods with specialist industrial buyers. Their presentation, expected information and purchasing behaviour are not necessarily alike. Analysis should relate to the product and customer; a generic explanation of exports is not sufficient for every type of goods.
How do statistical and fundamental analysis differ in this lesson?
What the session calls “technical” analysis concerns trade statistics and charts: import and export quantity or value, countries' shares, unit value, growth trends and the distance between consumer markets and suppliers. The article uses the term in the educator's sense, not as instruction in financial-market trading.
Fundamental analysis examines the reasons behind the figures. If a country's demand has grown, what changed in consumption, production, construction or distribution? If it buys from far away despite having nearby suppliers, why?
Within this framework, statistics help narrow the research scope. A large difference between countries can direct subsequent investigation.
Stating a cause without investigation, however, is no more than guessing from a number. In the example of declining imports, the educator explicitly says the chart cannot establish the cause with certainty.
The fundamental-analysis section also mentions travel experience, market observation and contact with participants. These can help explain consumption or distribution, although an account of experience is not the same as general statistics. The educator's experiences are included to explain his method, not as sufficient evidence of every market's current conditions.
From data to an option worth investigating
Product knowledge
Precise product definition and data scope
Assessing personal fit
Experience, interest, contacts and readiness to learn
Market assessment
Size, share, unit value and trend
Investigating the cause
Consumption, distribution, production and purchasing behaviour
Comparing execution capabilities
Supply, competition and customer relationships
Include the purchasing process and customer relationships in the analysis
A substantial opening section concerns business relationships. Drawing on his experience, the educator emphasises familiarity and trust in wholesale transactions. Product analysis should therefore go beyond identifying importing countries to understanding how to reach buyers and influential people in the purchasing chain.
Initial contact may not lead directly to a sale, but it can reveal market needs or establish a relationship with a buyer, bulk consumer or another organisation. Briefly answering every enquiry while expecting an immediate purchase limits opportunities to develop relationships.
In the video's model, the internet enables contact. Visibility should lead to discussion, understanding needs and building trust.
The practical analytical question is how customers for these goods usually find suppliers and what information and reassurance they need to begin working together. General claims about relationships' share of global trade have not been converted into figures here.
In an example of developing relationships, the educator explains that a contact may not be the final buyer but may know a factory manager, bulk consumer or another buyer. If the initial exchange ends with a brief price response, this knowledge may never emerge. In his approach, the quality of continued discussion is therefore part of market development.
In one account of international cooperation, initial contact leads to discussions of representation and expanding sales in the destination market.
The useful analytical point is to understand the contact's role: are they buying for their own consumption, supplying other organisations or operating a distribution network? This distinction can change the type of cooperation offered.
Details of claims about officials and political connections have not been republished in the article.
First ensure the statistics actually relate to your product
The session begins statistical analysis by identifying the goods' classification in customs data. Before using figures, establish which products the heading and code cover and whether they match the goods under consideration.
One statistical category may include different sizes, qualities or uses. In the pipes and fittings example, the educator shows that a small component has a different application from a large industrial one, even if the data groups them together.
Such statistics can provide an initial picture without revealing demand for the precise sub-product.
Part of the session concerns limits in statistical coverage and transactions not clearly distinguished in available data. A missing precise figure does not necessarily mean there is no market, while a large figure does not necessarily prove demand for our particular product. Data must be used with an understanding of its scope and limitations.
With broadly classified products, different markets fall under one heading. If a product is selected for a specialised industrial use, the entire category's value, including general-purpose goods, cannot be assumed to represent its market. The initial statistical picture needs to be supplemented with knowledge of the chosen product's application, size and specifications.
The session also discusses products whose modifications or special characteristics are not clearly reflected in the statistical heading.
The methodological lesson is to record research limitations: what part of the figure relates to our goods, and what do we not know? Without this boundary, an apparently precise report may claim more than its data supports.
What do the statistics say, and what still needs investigation?
Statistical observation
A market's imports have grown, or its share differs from others.
The fundamental question
Is the cause greater consumption, redistribution, changes in production or something else?
Compare the product with your knowledge, interests and learning capabilities
Alongside product information, the session's method examines the person intending to trade: work experience, educational background, location, familiarity with manufacturers, interests and willingness to study technical details. These factors can affect the choice of a suitable field.
Selling technical equipment may require capacity calculations, application knowledge and precise answers. For a conveyor, relevant order questions include the material, weight, throughput volume, route length and operating hours.
Anyone entering this field should be able to understand such information and coordinate answers with the technical team.
Not all products involve the same negotiations. Choosing a field requires understanding customers' questions and sellers' everyday work. Interest in an industry's name is insufficient; assess readiness to learn and perform its actual tasks.
If there is no particular product or contact at the outset, the educator suggests examining several fields and narrowing the choice. Broad labels such as construction or clothing are not yet specific products. After choosing a field, investigate its subcategories and the differences between working with them.
To illustrate differences in learning needs, the educator contrasts equipment such as wheelchairs or specialist machines with simpler products. Models and capabilities in the former can generate many questions. Sellers should be ready to study and explain details.
The comparison does not judge people's worth; it concerns whether daily work fits their interests and learning capabilities.
Social capital here refers to the contacts, experience and access a person already has.
In the educator's view, lacking an initial contact does not end the investigation; local capabilities and several fields of interest can be explored. Nevertheless, this article assumes no ready-made network or specific sourcing opportunity for the reader.
Examine the supply structure and dependence on the manufacturer
Product analysis should establish how many organisations control supply and what role the trader can have in the sales chain. The educator considers some markets harder because manufacturers hold greater power and intermediaries have limited discretion, contrasting them with products that can be ordered from several workshops.
The practical question is: if cooperation with a supplier ends, is an alternative available with suitable quality and terms? Can product specifications and commercial identity be maintained, or does the entire operation depend on one organisation's decisions? Examine this before investing extensive time in marketing.
The educator also discusses sustainable seller-manufacturer cooperation. When a seller develops a market for a manufacturer, the relationship may become more valuable to both. This is a possibility, not a guarantee that every manufacturer will accept terms favourable to the trader.
The example of production across different workshops illustrates an important distinction. If specifications can be maintained and several businesses can make the product, a trader's negotiating and supply position differs from total dependence on one manufacturer. The educator connects this possibility with establishing a commercial identity.
This example does not imply that replacing a supplier is always quick or cost-free.
Conversely, when suppliers are few or hold the stronger position in customer relations, the trader's share and the sustainability of their role need examination.
The concern raised is that someone may spend considerable time building a market but be unable to maintain cooperation or supply. This requires examining the particular relationship, not applying a uniform judgement to all private or state-owned companies.
Choosing a product is not merely choosing a country
Understanding and learning
Can specialist customer questions be answered?
Interest and experience
Does the field's everyday work suit the person?
Supply sources
How many genuine, verifiable supply sources exist?
Sustainability of the trader's role
Can cooperation continue and product specifications be maintained?
Separate market size from the profitability of your own activity
A product's familiarity or large global trade value does not necessarily imply attractive profits for a newcomer. The educator distinguishes transaction volume from the trader's economic outcome and advocates considering less frequently discussed products too.
Product assessment should consider the value the seller adds: understanding customer needs, selecting products, coordinating production, design or variety, providing specialist information and organising supply can shape the activity. Choosing solely by a country's export figure does not reveal these distinctions.
The session also emphasises diversity in using different production capabilities and skills. Workshop-made or specialist products should not be dismissed simply because they are less familiar. Conversely, mentioning a product's potential does not guarantee profit or prove current demand; each option still requires independent investigation.
In an account of rural production, he uses woven baskets as an example: a product someone might not initially include on their usual list of export goods. The story draws attention to local capabilities and existing skills.
Reported order quantities or household numbers are not presented as verified data. The transferable lesson is to look beyond a handful of well-known products.
Two levels of diversity should also be distinguished. The session supports varied export capabilities and skills, but still examines the field and sub-product when discussing an individual's choice. It is not a recommendation for a beginner to sell every kind of goods simultaneously.
Read imports at both global and regional levels
The next question concerns market concentration. If a large share of imports is concentrated in a few countries, the principal sales routes differ from a market whose demand is spread across many countries. A chart should help identify that structure, not merely reveal the largest importer's name.
To explain, the educator compares concentrated markets for certain raw materials with dispersed demand for consumer goods. The methodological lesson is to examine the number and shares of markets worth studying. Figures and rankings quoted in the session are not current statistics in this article.
In the bedding example, the chart shows the relative size of different markets. If several countries hold substantial shares, the question is whether several markets can be considered for investigation.
If most demand is concentrated in a few countries, examine dependence on those markets more closely. The number of countries alone is insufficient; their shares and types of demand also matter.
During the talk, the educator corrects himself while reading global and regional market sizes and expresses frustration with the display's lack of legibility.
For that reason, this article does not present reconstructed figures. It retains the questions: does the number refer to the whole world or one region? What exactly is the product? And on what measure are countries ranked?
A major importing country may be a distribution hub
High imports do not always mean all the goods are consumed in that country. The regional analysis also considers a market's distribution role. Goods may move onward to other markets, with part of demand arising from a regional sales network.
This distinction affects audience understanding. Selling to a distributor serving several markets differs from selling to a consumer or importer focused solely on its domestic market. Completing the analysis requires identifying who imports and where the goods go after entry.
In the method described, a high chart value starts the investigation. It raises a question, but a distribution role needs additional evidence. This article does not reach definite conclusions about a country's current situation from a chart alone.
In the regional example, a country's higher share first prompts further investigation; the discussion then turns to distribution into other markets.
The order matters: observe a difference, formulate a question, then investigate a possible explanation. If a distribution role is confirmed, identifying distributors and sales channels becomes important for the trader.
He also discusses introductions and market visibility. Understanding where customers in a region look for suppliers can inform communication content. This article does not invent a keyword list or advertising method in his name; it retains only the link between market understanding and presentation.
Consider competitors and possible transport advantages alongside demand
An export map shows where major suppliers are located. Comparing supply and demand locations can raise the question of whether another seller can compete through access and transport.
The final discussion of distance between supply and market complements this point: some markets buy from far away, while others rely on nearby suppliers. Investigate why. Geographical proximity alone does not establish a transaction's outcome or a transport route's suitability.
A map should be read according to its indicator. The educator distinguishes total value from share and notes that a country's geographical area is not a measure of its export share.
A small country may account for a significant share of a product's supply. Neither the size of a map marker nor the country itself should replace the figures and chart legend.
After identifying suppliers, their distance from consumer markets becomes relevant. If most supply comes from far away, a potentially closer source warrants investigation; if many nearby suppliers already exist, that argument may be weaker.
These are analytical questions; conclusions about cost or time require examining the actual service.
Do not confuse unit value with market size
Total trade value differs from value per unit. One country may trade large quantities at low unit values, while another trades smaller quantities at higher unit values. The educator uses this distinction to raise questions about product type and the market's price positioning.
Sellers need to know whether their product fits the lower-priced or higher-priced segment. Total import value alone does not clarify this. The session applies this examination to both importers and exporters.
In the towel section, the educator describes a difference between something he had heard about competitors' prices and the results of his statistical investigation.
The purpose of this account is to test claims: hearing that a competitor always produces more cheaply is not the end of the analysis. Establish which product, comparison criteria and period are involved.
The article does not repeat the account's ranking of the cheapest or most expensive countries because the historical data and a verifiable slide are unavailable. It retains the question: does a common perception match the information we find about the particular product? If not, why do they differ, and what further information is needed?
Three different measures when reading a market
Total value
The monetary size of product trade in the market being examined
Market share
A country's relative presence in that particular market, measured by a specified indicator
Unit value
Trade value per unit of quantity: a prompt to investigate product type and price positioning
Compare short-term and multi-year growth
Another part compares one-year and multi-year changes. Rapid growth in a single year differs from a sustained trend. A growth percentage alone also does not show the absolute change; the market's initial size matters. A large market with a low growth rate may therefore change by a different amount from a small market with a high rate.
When reading a chart, identify the variable: dollar value, quantity or market share. The educator distinguishes changes in volume from changes in value. Confusing these measures can change the analytical conclusion.
Declining imports also prompt further questions. The session mentions possible changes in domestic production or market structure, but the educator explicitly notes that the chart alone does not reveal the cause. Positive or negative data begins the investigation and should not become a definitive judgement of market suitability without understanding why.
When explaining bubble charts, the educator discusses both positioning against growth axes and market size.
Because the slides in the available source are not legible and verifiable, this article does not invent a legend for bubble sizes or axis directions.
The clear lesson is to compare short and longer periods and distinguish percentage growth from the quantity or value of change.
The talk also discusses a mature market: existing consumption may continue without much new growth. A developing market, by contrast, may generate new needs.
This difference does not establish that every low-growth market is unsuitable for every seller; first examine the entry objective, customer type and competitive conditions.
Fundamental analysis should connect the reasons for demand with business decisions
This understanding also affects product presentation. If a market requires particular specifications, quality or price levels, the sales offer should reflect them. Choosing a language, explaining applications and emphasising relevant features becomes meaningful when the audience is understood.
Analysis should produce more than a collection of charts. For each option, explain exactly what the product is, how closely the data matches it, how customers buy, what supply constraints exist, where competitors stand and why the route fits the seller's capabilities.
Such a summary makes it possible to compare options without assuming in advance that any one will succeed.
Reviewing the analytical sequence in the bedding example
The analytical sequence in the bedding example
- To see how the discussion connects, the bedding example can be reviewed thematically. First clarify the product name and statistical category, then examine global and regional trade size. Importer shares and the concentration of demand then indicate which differences warrant further investigation.
- Next, major suppliers and their distance from consumer markets are examined. This raises questions of competition and possible transport advantages. Unit value also raises a question about market price segments: does the product we intend to supply match what that market buys?
- Trends over time are then added to the picture. If imports rise or fall, investigate the reasons. For bedding, the educator suggests possible links with construction, hotel development or changing national conditions. These are explanations to investigate, not proven causes of every change in the data.
- Ultimately, market information returns to the individual's capabilities: can the product be sourced? Does the seller have the necessary knowledge and readiness? Is their role in the supply chain sustainable? Can the route to customers be identified? Connecting data, causes and execution capability is the central substance of the method presented.
The bedding example: connecting the questions
Product scope
Which category and sub-product are being examined?
Market and competitors
Where is demand, and where does supply originate?
Price and growth
What differences do unit value and trends over time reveal?
Reasons for demand
What consumption or activity lies behind the purchase?
Practical fit
Does the choice fit personal capabilities and supply conditions?
About this talk
This article is a thematic adaptation of Mostafa Nezamparvar's lesson in the video on this page, based on automatic Persian captions, not a word-for-word transcript. The session itself mentions illegible slides and corrections to figures. Ambiguous numbers, country rankings and conclusions dependent on old statistics have therefore not been reconstructed. Promotional sections, unverified claims and unrelated examples have been omitted. The article explains an educational analytical method, not an up-to-date market report, investment recommendation or customs-declaration instruction.